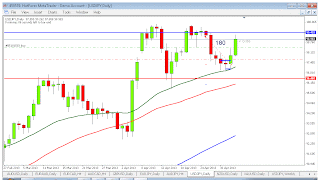
In my last post I showed a short entry at USD/JPY pair. The price was moving down towards recent swing high. The dynamic and diagonal trend line was also nearer. So a nice confluence that was likely to push the price upwards. But if price doesn't reverse from this confluence then I can get much more pips here. So without exiting I moved my s/l to a tighter position.
 |
| Figure 01: USD/JPY D1 Chart |
I grabbed 180 pips here. Now as the price is at a confluence here in the background of an uptrend and price is just bouncing back from the dynamic support area, I joomed into 1H time frame where I found price was in a range & just broke upward TL. So I put a pending long entry above the breakout candle.
 |
| Figure 02: USD/JPY 1H chart |
I was busy with my work then. Today when the market is closed, I got the chance to look at the chart. Look what I've found-
 |
| Figure 03: USD/JPY 1H chart |
I'm now in 50 pips profit. I would have moved the s/l to BE if I could visit during market open hour.
In XAU/USD pair, daily chart, price was retracing in a down trend and price was ranging at 50-61.8% fib level. I entered a short position at the upper band.
I took the trade in 15m TF. I got out with 100 pips profit with my pre determined T/P.
EUR/JPY pair: Trend is uptrend, price was retracing and now bouncing back from dynamic and diagonal support area. Price is not at the exact support area. Price is ranging now in 4h tf. Long entry possible with the breakout of this range. But I don't want to go for it as it didn't reach my dynamic support area.
AUD/JPY pair: It's similar to the eur/jpy pair except, the price is in exact support area. Price was in retracing bear channel. Price broke the channel and I missed the long entry.
Good luck for next week.


