Today price was on downward from the start of the day. In a downhill course I entered a long position.
 |
| Figure 01: EURUSD 5m Chart |
Price immediately started to go against me. I exited with few pips loss. But if stayed with my s/l, I could gained some pip. I exited as an expert trader of 5m Force strategy (not the owner) developed a rule of getting out of a trade entered by 5m Force rule after 3-4 candles with no gain. In this way they minimized the loss size. But few of my good entrys caught by doing this. More than a couple of times today.
Next entry of short was taken by 5m Force strategy and supported by supply/demand trade strategy by SAM SEIDEN. As I'm just studying now, I may do wrong. Please notify me of such trades I'm showing here.
 |
| Figure 02: EURUSD 5m Chart |
Price was making Lower highs, stoch was touching the overbought line. Truly speaking, MACD was lagging. Price was had first pull back from the supply area. Price went to my direction. I waited for my desired profit level with overlooking the daily pivot line. Look price went down right from the daily pivot line on the reversal candle but ultimately it went up and produced a good long signal. But I was blinded by the previous entry. I missed it and my previous entry hit s/l and ultimately loss is everywhere.
The owner of the strategy as well as any good and successful trader always say that when we're into a position, always aware of developing another position from opposite side. This will show you an exit as well as a good entry from the opposite side.
After price going upwards, crossed the weekly pivot. From there a good short signal developed. But I didn't entered as the pivots are around. If I took that, it could become the trade of the day. Price smoothly went down.?? ?
 |
| Figure 03: EURUSD 5m Chart. "Decending triangle" |
On the way price gave another long signal before forming a symmetrical triangle which is a continuation price pattern. ?Missed the long entry but took the short signal there.?
 |
| Figure 04: EURUSD 5m Chart. "Symmetrical triangle" |
Due to one of my EA I got out of trade with 10 pips, I entered again (I shouldn't do it, but I did to see how far it could go).? Produced another 8 pips. Then I had a long signal. I took that but it went to opposite direction. I large candle thorwed me out.
Price actually was revisiting a lower demand area for the first time after first getting out of the area as a result of imbalance of buyers and sellers. With this pull back from the demand area- look the price movement potential outlined in the terminal window.
 |
| Figure 05: EURUSD 5m Chart |
Look the demand area of bounce. Let's look at a closer view.
 |
| FIgure 06: EURUSD 5m Chart. |
I've put an arrow to show possible price movement from the pull back from the demand area. Let's see what happened next.
 |
| Figure 07: EURUSD 5m Chart |
Price nicely followed my anticipated direction. I'll need to learn these patterns more as these patterns nicely coincide with the 5m Force strategy and strengthens the signal.
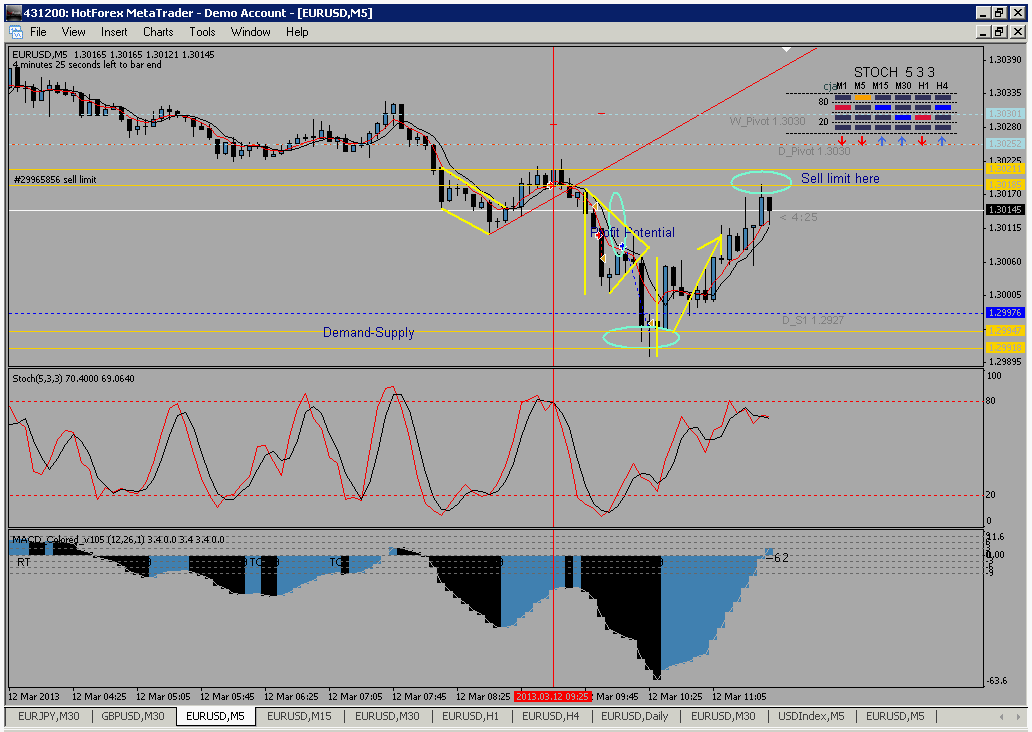
With the rally upwards, price was approaching the upper supply area for the first time after going down from the this area before. So I put a sell limit at the lower level of supply area. S/L was set to daily pivot.
 |
| Figure 08: EURUSD 5m Chart |
Price went nicely up and bounce back triggering my sell limit order. Now wait to watch the move to south.
 |
| Figure 09: EURUSD 5m Chart |
It started to move downwards. But the 5m force gave an opposite signal on the way.
 |
| Figure 10: EURUSD 5m Chart |
The signal was by 5m Force Advances strategy. It was a buy signal. I had to move away from the terminal so I activated the EA but forgot to change the set up. That's why I got out with 8 pips. Luckily I got back to my terminal quickly and re-entered again to have the experience of the price action.
 |
| Figure 11: EURUSD 5m Chart |
I was expecting that price will reach DS1 line. But it missed.
 |
| Figure 12: EURUSD 5m Chart |
Price started to move north and there was a force long signal. Stoch missed the oversold area by a very low margin. I was out of the trade. Then a short signal by 5m Force Basic rule, a long signal by 5m force advanced rule and a short signal by 5m force basic rule came.
 |
| Figure 13: EURUSD 5m Chart |
Fear of loss I observed the first 2 entries and took the last one. Got some pips. But I should take the earlier two and leave the last one. The last entry was during the NY sesseion open. Price was producing a long signal but I missed it as I was watching the earliar entry.
 |
| Figure 14: EURUSD 5m Chart |
After open and with 5m force long signal, price suddenly went up with a big swing withougt any significant news release. During finding out the cause and any indication or price up- I found the following.
??
 |
| Figure 15: EURUSD 5m Chart. "Symmetrical triangle" |
I found that price was forming a symmetrical triangle at that time. So price could go from any where. Price choose upward move. I missed the 5m force entry as well. On its sharp rise price stopped at one place where it was seemingly producing an area of buyer-seller equilibrium but sellers were defeated and created an area of demand.
 |
| Figure 16: EURUSD 5m Chart |
After leaving the demand area price revisited the area where I already put a buy limit order. In the image it was written sell limit. Sorry for my mistake. I haven't edited the original pic. I'll edit it later to remove the word sell and replace with buy.
 |
| Figure 17: EURUSD 5m Chart |
I grabbed 32 pips there. It was written 20 in the image. It's because, at the pause of price movement in the middle of the rally I calculated and wrote 20. I haven't edited it finally. Price started to move downwards again and on its way it was creating area of supply. Price was on the way to revisiting a previous area of demand. And it was a first revisit after rallying upwards.
 |
| Figure 18: EURUSD 5m Chart |
I placed a buy limit entry. But I missed it. I miscalculated the limit buy entry. Actually this type of order was my first of a kind in action. Screen price value was ask price. But I put the ask price in my buy limit order. If I would calculated it right and put the bid rate in order then my order would have been triggered. I could have gained at least 10 pips if not more as because price moved more than 15 pips.
Total gain today is more than 35 pips. I have on more pending order on screen. Buy for today.
Happy pipping.