Today, Price tested both the daily pivot and weekly pivot. It was somewhat expected as there was multiple high impact news were scheduled to release. Initially in the morning today after Tokyo open, price started to move sideways.
 |
| Figure 01: EURUSD 5m Chart. "Tokyo open" |
?Actully on this sideways movement, price was slowly moving up towards the daily pivot line. Few bars before the London open price gave a valid long signal.
 |
| Figure 02: EURUSD 5m Chart. "London Open" |
Today I decided not to open before London session open. I'll just watch what happens. Price nicely went up. Price bounced on the DR1 and started to fall back.
 |
| Figure 03: EURUSD, 5m chart. |
Price nicely rallied down more than 35 pips. Then price on its downward movement, started to create higher lows. There a good long signal was being developed. I missed the former short signal. But I watched the long position to collect nice 15 pips slowly.
 |
| Figure 04: EURUSD 5m chart. |
?Price was now approaching NY open. Before and after the NY open there was scheduled news release. That's why long position needed to be closed. I've marked the news and NY open time with vertical line.
?
"EUR minimum bid rate" was schedulede to release 15 minutes before the NY open.
 |
| Figure 05: EURUSD 5m chart. "EUR minimum bid rate" news effect. |
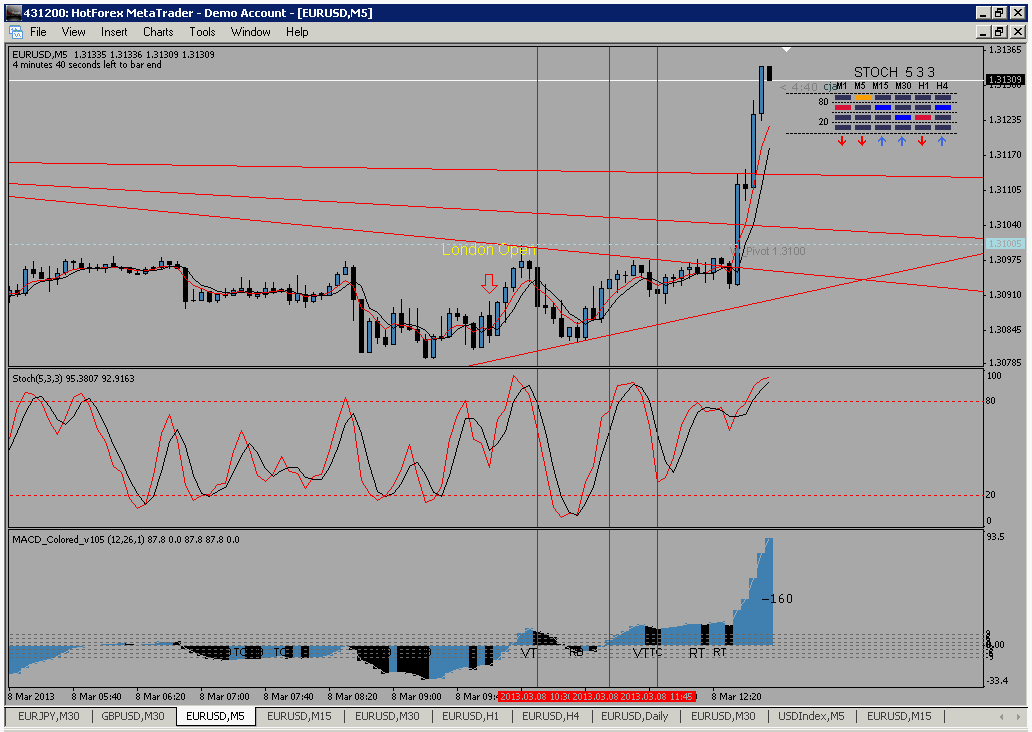
?Price sharply moved down. After the 5m news bar, price slow went down and started to make higher lows to give a long signal. As high impact news was coming, I refrained from entering any position. I'll trade these later. Now just watching.??
 |
| Figure 06: EURUSD 5m Chart. "USD trade balance & Unemployment claims" |
??Here I want to show some interesting thing. First the current issue. I shifted the vertical line 1 candle back to show the movement range after the release of news about USD trade balance and unemployment claims. Price initally showed a fake movement downwards more than 20 pips. Then price moved upwards more than 35 pips on the same candle. Second thing I want to show you is the news event before the NY open.Look that news event during it's release, produced a good sell signal by the force 5m system.
Now see the dollar index and where price moved afterwards.?
 |
| Figure 07: Dollar Index, 5m chart |
 |
| Figure 08: EURUSD 5m chart. News after effect. |
At the weekly pivot and DS2, price made double top. From there price is now moving sideways.